 |
|
|
| Home | Computing | DAQ | Notes | Meetings | Subsystems | Search |
|
|
| |||||||||||
This page contains technical information about data visualization in LHCb, including documentation for developers and expert users of the LHCb event display (Panoramix).
A nice page for first time users of Panoramix, maintained by Thomas Ruf, is available here. It includes an introductory tutorial (.ppt, .pdf) and a picture gallery. See also the Panoramix FAQ.
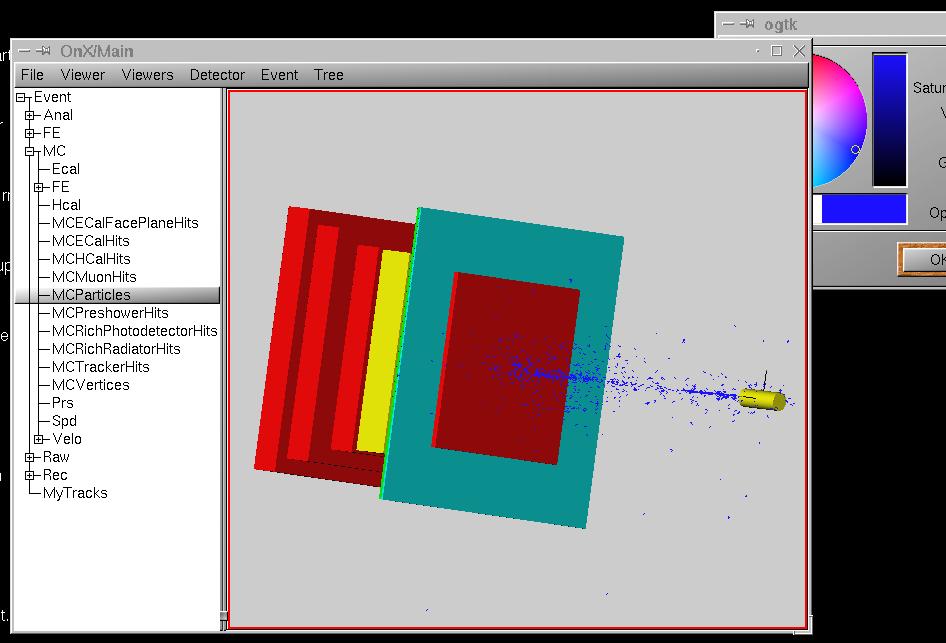
| The LHCb model for data visualization is described in some detail in the Data Visualization chapter of the Gaudi User Guide. You can refer to it to get an overview of how data visualization (and user interactivity) is added to the Gaudi Framework. In the current implementation, data visualization is provided by a number of Gaudi services (OnXSvc, SoLHCb, etc.) |  |
The visualization set of services are based on the OnX package for interactivity and Open Inventor (SoFree implementation) for the graphics . The design of the services and the technologies on which it is based is described here.
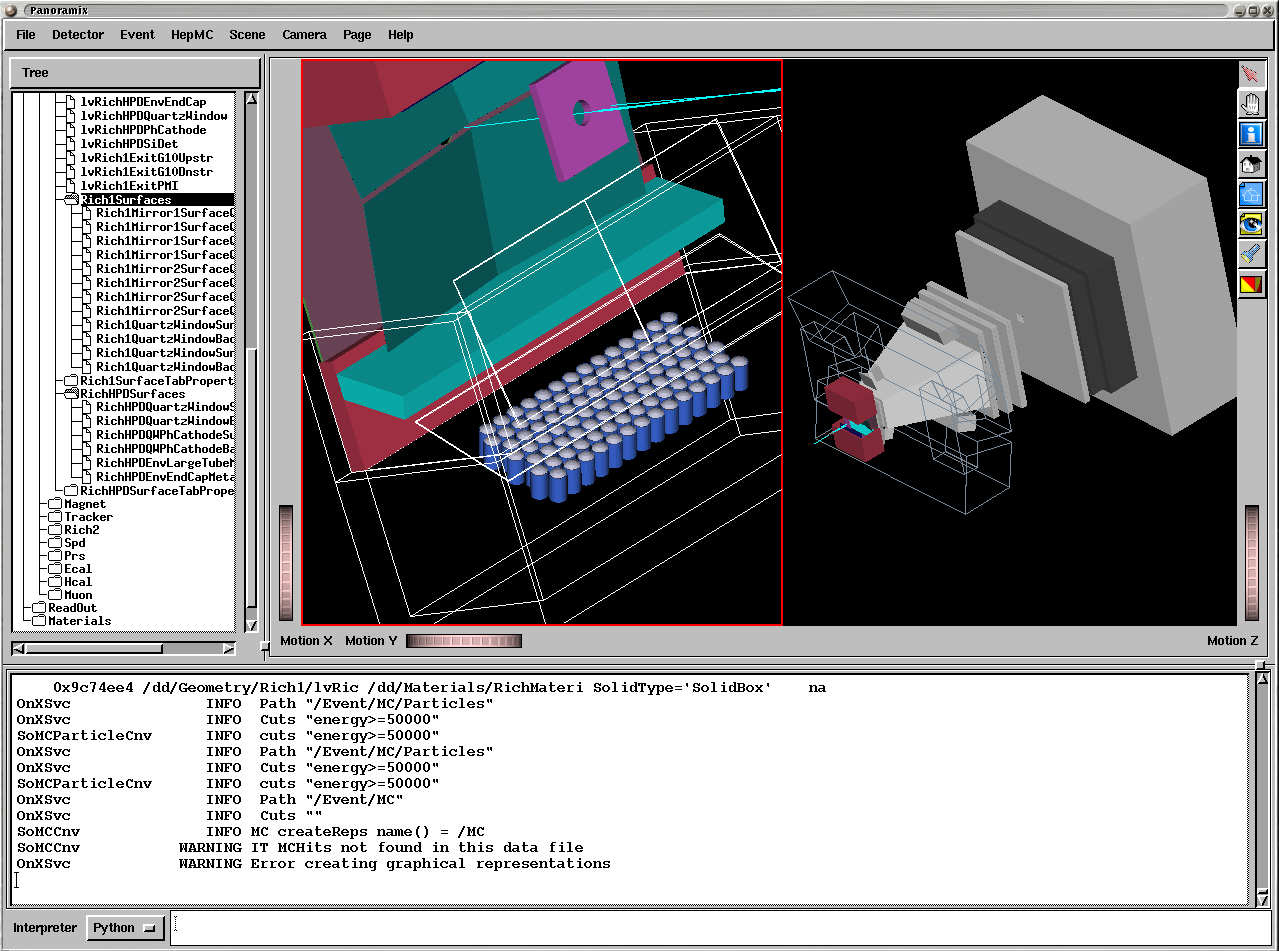
| The Panoramix event display is being constructed. The idea is to pre-build and pre-configure an LHCb event and geometry display application ready to be used by LHCb software developers and physicists. In addition, to have a pre-configured application it should be easy to extend it with sub-detector visualization modules to visualize sub-detector specific data (event data and geometry data). |  |
| Package | Version | Description (notes) |
| Vis/Panoramix | v11r* | development version: uses the latest releases of all projects |
| Vis/Panoramix | v9r* | DC04 compatible version: uses the latest DC04 compatible releases of all projects |
| OpenScientist | v12r0p1 | is currently used by both Panoramix versions |